Mathematical Model of Conduction in Wires
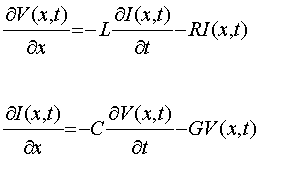
From Maxwell's equations one can derive the one-dimensional equivalent
applicable to conductors

They are known as the telegraph equations and relate the electric current denoted by I and the electric potential difference denoted by V to each other. The symbols C, G, L, and R represent, respectively, the capacitance, conductance, inductance and resistance per unit length of the wires. The geometry and composition of the wires and their surroundings govern these parameters. And again, there is no need to understand these equations even though we will use them in the upcoming simulation. The results will be displayed in a separate window, which will appear in the upper left corner. You are therefore advised to make room for it by adjusting the width of this text window. Should you choose to maintain overlapping text and graphics windows, activate the graphics window only by clicking its upper border. The interiors of all graphics window are active "Start-Stop" controls and may trigger unwanted action.
In subsequent pages you will find a large number of links, some of which
are referring to other texts and should be familiar to the web browser
user. What is new in this course are the links that initiate dynamic presentations.
These are always identified by the red button
which initiates a larger display window and
calling a smaller one. They do not affect the browser state nor are they
subject to the "forward" and "back" controls of the browser. A single click
with the mouse button is needed.
Choose between the large and the small simulation window . If you change your mind after the fact you can always click the "Quit" button in the simulation window.
Two parallel wires are shown in yellow and the window is surrounded by controls in geographical relation with the items they control. For example, all controls of the sources connected to the left ends of the two wires are placed to the left while all the termination controls are found on the right near the load end of the wires. The controls of line parameters are placed above the line. The Reset and Quit controls are also there and the simulation speed control is on the bottom of the window. This scheme has been adhered to in all subsequent simulations and animations to the extent possible.
Sources

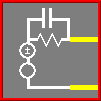
Start the simulation by clicking inside the window with the left mouse button. Another click will stop it. The prompts in the window always alert you to what the next click will do. This method is employed in all simulations and animations that will follow. Outside the changes of the prompts nothing should be happening since no sources are turned on. At the left end of the wires there are two sources that can pump electrons from one wire into the other. The top source is a plain battery that can be toggled on and off with the dc button in the left panel, a copy of which is reproduced here as an inactive icon . Try a few successive on and off cycles and observe the transients traveling from the source towards the load. The green graph just below the wires shows the magnitude of the current I along their entire length. Below it is a graph of the potential difference V between the two wires. When in the "on" state the dc button should show a checkmark within its square. Leave it in the off state and then experiment by clicking the ac button. This controls the lower of the two sources and, of course, both can be on at the same time if so desired.
Just below the ac symbol is a large button containing the symbol ![]() .
.

When you push it you change the electron pump from a voltage
source shown on the left to a current source shown on the right
and vice versa. . Note the symbols inside the circular source which change
accordingly.

The configurations of the source resistor and the capacitor at the input also change in conformance with the convention and in synchronism with the pushes of the button. Further down, in the left control column, are the value controls for the source resistance Rs, capacitance Cs and frequency Fr. The latter is applicable to ac only. We will teach you how to use these as the need arises and, please, do not operate them at this time. Before you proceed make the source into a voltage one so that the plus-minus symbol is visible inside the upper source.
Terminations

The right hand side of the two wires can be terminated in any one of the six choices shown. The toggle selectors operated by mouse clicks indicate the present selection with a dot inside the circle. The corresponding symbols of terminations are also placed between the ends of the two wires in accordance with the invoked selection. The first from the top down is a Short, followed by a resistor which is the default termination. Below it is a series combination of a resistor and a capacitor ResCap followed by a pure capacitor Cap. Below this is an inductor Ind and at the very bottom is an open circuit Open. If you have not been clicking the selections while reading the text, do so now and observe the effects they have on the terminating conditions. Of course, only the graphics window controls are active. With the ac source turned off and the dc source in the checked position try the various terminations and note some predictable and some surprising behaviour of the current and of the potential difference. Along the way try also switching between the voltage and the current source. As always, you can ponder a snap shot of a given state by freezing the action with a click inside the window.
With a short, there can be no potential difference across the wires and the current I must increase in the absence of the resistor. With an open circuit, there can be no current flowing from one wire to the other but the voltage V increases because of it. As a matter of fact the current and voltage, respectively, exactly double in these two cases. We will gain a full comprehension of this behaviour in the Physical Model of Conduction.
Reflections
It is crucial to accept the fact that the conditions imposed at one end of the wire take time to propagate to the other end. We have seen this in the experiments performed so far. At the input one can impose a potential difference V between the two wires by means of a voltage source or force a current I into them from a current source. In either case the ratio V/I at the input is strictly determined by the geometries of the wires as we shall see later. Assuming that geometry to be uniform along the whole length of the wire, both V and I propagate unchanged towards the load end. If the output conditions cannot support the ratio V/I, the conflict is resolved by a correction which propagates back towards the input. Such corrections may propagate back and forth for some time depending on the losses in the wires and on the ability of each end to support the arriving ratio of voltage and current.Our resistor Rs at the input has been chosen in such a way that it can absorb any mismatch of conditions imposed by the output. As a matter of fact it has been made equal to the ratio V/I which the simulated wire geometry imposes. There is only one such value of Rs for a given wire geometry and it is called the characteristic impedance . As we peak behind the scenes of the processes at the wire ends we will understand how the wire geometry controls the ratio V/I and how a resistor of that value prevents the reflections from occurring.
You may want to do some more experiments and one that is recommended consists of substituting a current source for the voltage source and vice-versa by alternate pushes of the source selection button in presence of dc signal on the wire. Observe how the match at the input is achieved regardless of the output conditions. Note the voltage drop in the series resistance of the voltage source when the output is shorted or observe the current sink in the parallel resistance of the current source when the output is open. In this latter case all the current flows into it.
We will now reduce the value of the source resistor Rs to zero in order to observe the disturbances caused by a mismatch of conditions at the input. Reset the circuit by actuating the pushbutton in the upper left of the simulation window. Then click the Rs button in the left control panel and a new window will appear. This allows you to change the resistor from the present value of 50 Ohms. A few clicks on the "-10" decrementor button will accomplish the task. When zero resistor value is indicated click the "OK" button. We have now a direct connection of the voltage source to the line without any cushioning lossy element. Turn on the dc source and start the simulation by a click inside the window. Note the voltage and the current to be twice as large as before. But their ratio remains the same because it is controlled by the wire geometry itself. The output default termination which we have forced when resetting, happens to be equal to the wire impedance. Therefore we have no mismatch of conditions there. But this is no longer true if we change the output conditions which we will do soon. In the mean time you are invited to take a side trip for some interesting explorations. If you prefer to pursue the main topic skip the next section.
Standing Waves
The fairly trivial experiments which we have pursued so far are leading to the resonant case which we want to use as our object of studies. Somewhat more interesting are the cases of capacitive or inductive terminations with AC signals and there is almost an unlimited opportunity for experimentation with the line parameters. These can be accessed via the buttons above the two wires in the way just introduced with Rs.There are numerous experimentation opportunities with all the parameter,
excitation and termination controls available and the reader is encouraged
to exploit them at will. The Reset button should provide the comfort
of returning to the default state. For those interested in the standing
wave phenomenon the following experiment is suggested. Reset the simulation
with the Reset button and start it with a click inside the window.
This time turn on the ac source and observe a traveling wave going
down the line. Induce a short at the end and observe the formation of a
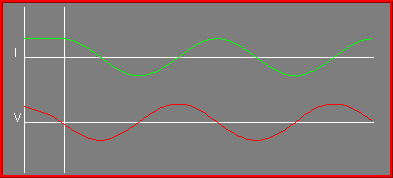
standing wave which should be similar to the one shown here.

. If it is too fast reduce the speed with the slider on the bottom of the window and repeat the transient by switching between a resistive termination and a short.
The standing wave is known to be the summation of the forward and the backward waves. This can be demonstrated by starting out from a shorted line and steady standing wave and turning off the ac source. This removes the forward wave and all that is left is the backward wave going from the load into the source. After you have performed this experiment, reset the simulation and set the source resistance to zero before continuing.
Resonances
Force the output to be open-circuited. This is achieved by clicking the lowest round shaped button in the right hand side control column. This produces a mismatch but also a lossless termination so we have now a system with no losses anywhere and with a mismatch on both ends. We should therefore not be surprised to observe some repetitive effects to take place when we supply energy into the circuit. To this end turn on the dc source and click over the window to start the action. Observe the voltage and current relationships which are triggered alternately at the input and at the output and which repeat as a quadruplet. Each of the four phases represents one quarter of the total cycle of a periodic signal whose wavelength must be four line lengths. In this simulation the quarter wave resonance phenomenon, as this is called, would continue forever but in reality the wire losses would slowly absorb the energy and reduce the amplitudes. Radiation from electrons while changing the direction of flow would also tend to reduce the amplitude.An equivalent behaviour is induced if we short the line and drive it with an ideal current source at the input. This implies an infinite shunt resistance Rs which we can approximate by a value much larger than the characteristic impedance which is 50 Ohms in our case. Reset the simulation and switch to a current source. Force the value of the resistance Rs to a few thousand Ohms by patiently incrementing with the "+100" button. Then induce a short at the output, turn on the simulation with a click over the window and turn on the dc source. This time the quarter wave resonance will have a different phase relationship between the current and the voltage but will also slowly decay depending on the value of the source resistance. We will later reproduce these two cases of quarter-wave resonance from physical laws governing the flow of electrons in wires.
This concludes our guided tour of the mathematical model of conduction of electricity in wires. The reader is encouraged to return to this simulation at a later time and to experiment with the multitude of interactive and parametric controls provided. Our attention, though, will now shift to the physics of phenomena we have just observed with the aim of a full comprehension of the underlying mechanisms. Before we can make any headway in this direction we must understand the fundamental principles which govern the interaction of moving electrons. So, unless you wish to experiment further with our mathematical model of the transmission line, you may quit now by actuating the Quit pushbutton. Then proceed to the section Physical Model of Conduction .