Sampling Theorem and Frequency Spectrum Aliasing
A band limited signal is a signal, f(t), which has no spectral components beyond a frequency B Hz; that is, F(s) = 0 for |s| > 2Aliasing
A number of practical difficulties are encountered in reconstructing a signal from its samples. The sampling theorem assumes that a signal is band limited. In practice, however, signals are time limited, not band limited. As a result, determining an adequate sampling frequency which does not lose desired information can be difficult. When a signal is under sampled, its spectrum has overlapping tails; that is F(s) no longer has complete information about the spectrum and it is no longer possible to recover f(t) from the sampled signal. In this case, the tailing spectrum does not go to zero, but is folded back onto the apparent spectrum. This inversion of the tail is called spectral folding or aliasingRecognizing Aliasing in the FFT
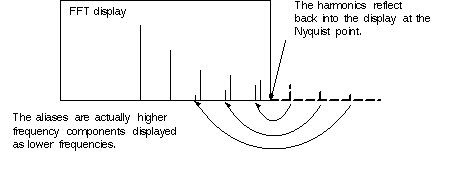
The highest frequency that can be input into a sampler without aliasing is half of the sample frequency. It is common to have acquired signals with a fundamental frequency less than half the sample rate, but the harmonics of that signal may be greater than half the sample rate and they will alias. This shows up in the FFT as frequencies that fold back into the display. Here are three methods for identifying aliases if they occur.Aliasing of Higher Harmonics
Fast-rising edges in a waveform create many high-frequency harmonics. These harmonics typically decrease in amplitude as their frequency increases. Figure 1 shows how these harmonics fold back into the display at the Nyquist point and are easily identified.Figure 1

Unfolding of Aliased Components by Increasing the Sample Rate
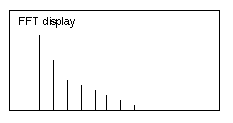
A second way to identify the aliases in the display is to increase the sample rate. This will increase the Nyquist frequency point and cause the aliased signals to unfold and no longer be aliased.Figure 2, below, illustrates how the signal in Figure 1 would unfold as a result of adjusting the sample rate.
Figure 2

Varying the Signal Frequency
A third method of identifying aliases can be used if the input signal's frequency can be adjusted. As the input frequency is increased, the non-aliased harmonics will move toward the right-hand side of the screen. However, the aliased harmonics will move toward the left. It is also possible for the aliases to move toward the right. As the input generator frequency is increased, the aliases move toward the left of the screen. When they reach the edge, they will reflect back into the display and begin moving toward the right again.
Figure 3
